

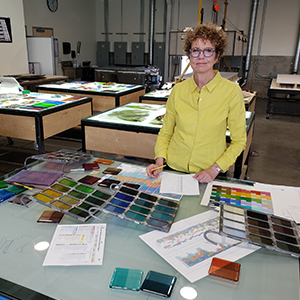
Laurie Frick Biography
- Born: 1955, Burbank, California, US
- Place of residence: Austin, Texas,
- Education: Master of Fine Arts from New York Studio School; Master of Business Administration from University of Southern California; NYU Interactive Tele-Communication Program, NY; Harvard Executive Business Program, London
- Collections/notable accolades: TEDx Talk 2013/2018; Lecture at Google; Customized Application called FRICKbits. Collections: Neustar, CA; Facebook, TX; Lehman Foundation, NY, CapitalOne, VA, University of Texas, TX
- Frick’s website
Transparent Data
Fused glass and mild steel
By Laurie Frick
Location: Level 3, ZACH
About this Piece
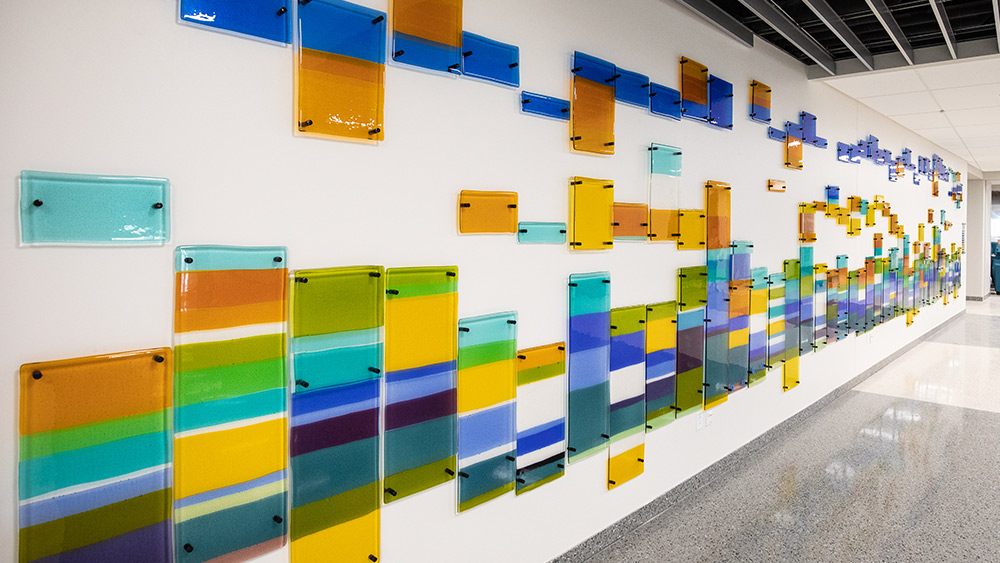
“Transparent Data” is a piece about Texas A&M University College of Engineering students. It tells a human data story about the long history and a closer view to what students are working on now.
The installation represents current science – and points to how we’ll consume data increasingly gathered about us. Rather than shy away, engineers at the leading edge will use patterns of data to understand and solve problems. Numbers are abstract concepts, but humans understand pattern intuitively.
We hunted for data, with an enormous assist by the College of Engineering to dig deep into the university archives and found paper records over 100 years old to verify graduate degrees by specific department for every year going back to 1880. A trove of seemingly innocuous recent data about the projects from the Engineering Project Showcase was compiled and categorized, with size of teams, department, sponsors, poster content and long written descriptions of over 730 projects involving thousands of students over the past five years.
From the projects we were able to classify and use probabilistic math to predict the polarity of sentiment, whether the approach was positive, negative or neutral. These are the same software tools analyzing unstructured text from enormous quantities of writing to categorize and classify for government agencies and global companies. Turns out machine learning tools are very good at assessing details that are unnoticed to the human eye. Tone, authenticity, leadership clout, quantitative approach, analytic logic are just some of the measures gleaned from the analysis. All scores and numbers turned into comparison data to decide size, placement and color coding for each piece of glass.
This installation is like portraiture, a data portrait – we hunted to find the essence and what is distinctive about the engineering college at Texas A&M. It is the camaraderie, the sense of belonging and what binds students together is that they do things. They are ‘doers’. That’s what drove me to look at analyzing student projects and the degrees accomplished at Texas A&M.
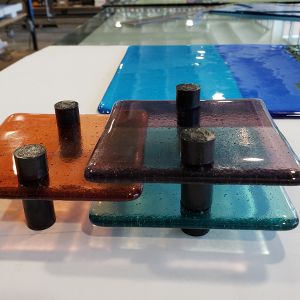
We were really excited about the data and the unique story it could tell about the College of Engineering, and then we struggled to find the right materials that melded with the concept and would make the space warm and inviting. We mocked up wood, steel, industrial felt, recycled resin and finally as we looked the possibilities of fused glass we could see the permanence of color and luminance of the material was perfect. Glass gets stronger over time, a lot like Texas A&M.
Two walls tell a story – the left wall starts at the beginning – 1880, and while the growth chart is reversed, upside down, it forces you to look closely. It reflects the numbers of graduates from 1880 to now, visually connecting students to the mass of graduates before them. Each color is a different department, size is the number of graduates each year. Movement in the data shows adaptation and innovation in response to world changes – an organic response that will continue to shift and change. The growth is unmistakable.
The right wall zeros in on the engineering projects, analyzing the hundreds of student teams who demonstrate their work in the annual showcase. This is a sample of 40 projects reviewed on 10 dimensions using artificial intelligence and machine learning software tools for text and author analysis. Size of color blocks are numeric scores, each color is a dimension, each column is a project team. Instantly you see the diversity and range of approaches that make up each successful outcome. Looking at the piece from any angle, you have dimensionality, depth and color.
“Like a fingerprint, no two people have the same data set…but what’s more remarkable is the idea that within all these numbers lies a better way of understanding ourselves. The information doesn’t just provide a broad document of a life lived in the early 21st century: It can reveal something deeper and even more essential.”— Laurie Frick